 Select Activities
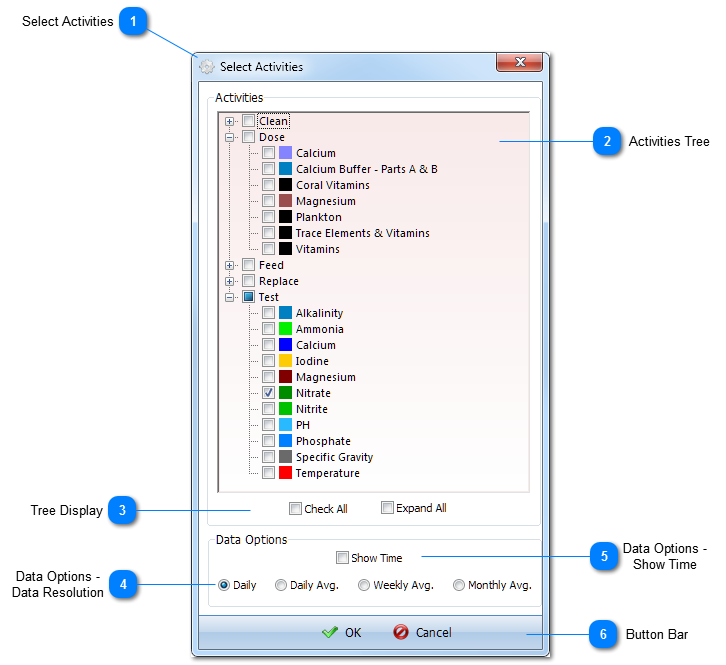
To open the Activities Picker, press the Activities button on the Chart form or Tabular Analysis form.
The Activities Picker is used to select what Activities to include in a graphical or tabular analysis. You also set the data resolution here.
|
 Activities Tree
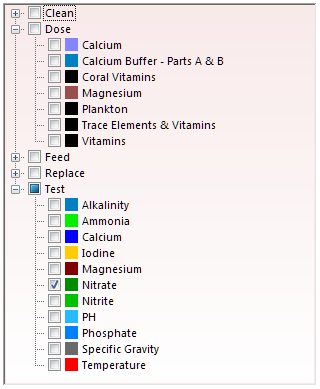
Use the Activities Tree to select the Activities you want to include in the current Chart or Tabular Analysis.
Any Activity that is checked in the PLOT? column of the Activity Definition tab of the Aquarium Settings window appears here. The color for each Activity corresponds to the color specified in the Activity Definition.
|
 Tree Display
Check All
Check to select all Activities. Uncheck to deselect all Activities.
Expand All
Check to expand all branches of the tree. Uncheck to collapse all branches of the tree.
|
 Data Options -
Data Resolution
Select a Data Resolution for the Chart or Tabular Analysis.
Daily
Displays all data points. This includes multiple measurements of the same water parameter on the same day.
Daily Average
Calculates the daily average for each each type of measurement. Displays one value per day for each type of measurement.
Weekly Average
Calculates the weekly average for each each type of measurement. Displays one value per week for each type of measurement.
Monthly Average
Calculates the monthly average for each each type of measurement. Displays one value per month for each type of measurement.
|
 Data Options -
Show Time
Check to show the Time, in addition to the Date. The Time column will only appear when the data resolution is set to Daily.
|
 Button Bar
Press OK to accept the settings. Press Cancel to discard any changes and close the window.
|
|

