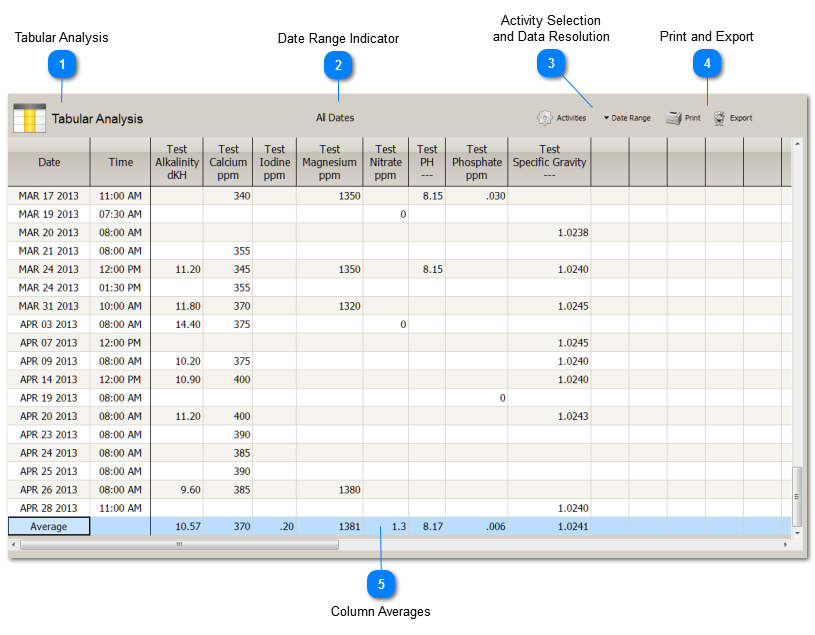
 Tabular Analysis
Activities that you record in the Activities Register can be displayed in Tabular Analysis.
Tabular Analysis presents each Activity as a time series that occupies one column in the table. This makes it easier to understand exactly at what dates an Activity was performed, to spot trends in an Activity’s data, and to make comparisons between Activities.
A unique feature of BlueChromis is the ability to analyze more than just measurements. Here's a small example comparing calcium dosing to calcium measurements:
Analyzing Dosing Calcium on Calcium Levels
|
 Date Range Indicator
Indicates the currently selected Date Range.
|
 Activity Selection
and Data Resolution
Activities Picker
The Activities Picker is used to select what Activities to include in the tabular analysis. You also set the data resolution here.
Date Range
Displays a dropdown menu to select Activities within a range of dates. See Date Range.
|
 Print and Export
Print
Print the contents of the Analysis.
Export
Save the Analysis in another format. For example, export in CSV format to use the data in a spreadsheet program. See Export.
|
 Column Averages
The average of the values in the selected Date Range for each column. For instance, if the Date Range is the Last 30 Days, then the average values will be 30 day averages.
|
|


