 Let’s say you have an entry in the Activities Register for Clean Gravel. Why would you ever want to enter a value in the QTY column for this type of activity? Seems pretty pointless, doesn’t it?
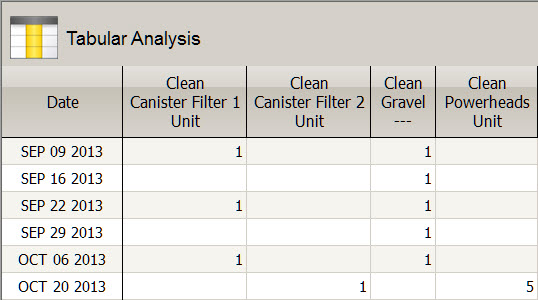
Well, the answer lies in BlueChromis’ unique ability to include any type of activity in Tabular or Graphical analysis. In the image below, BlueChromis is using Tabular Analysis to provide a quick overview of activities related to cleaning. In most cases, a value of 1 was used in the Activities Register so we can show that an activity took place.
If we had left the Activities Register QTY empty for these activities, we would not be able to see them in Tabular Analysis. This is because the columns above would all be blank. Instead, we would have to search or sort the Activities Register, and view the activities there. It’s normally more helpful to examine these in a Tabular Analysis. That way we can see several activities at once, in an easy to review format. For instance, we could view all the Clean type activities to get a concise overview of what was cleaned, and when. We’ve used the number 5 in the last column to mean that 5 powerheads were cleaned.
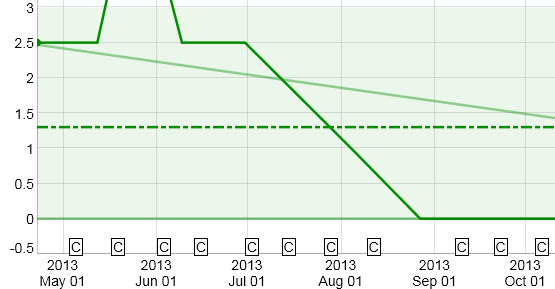
Ensuring a value for the Activities Register QTY also enables us to display any activity on a chart. In the chart below, icons (shown at the bottom of the graph) are used to indicate when a canister filter is cleaned. Choosing icons as a line type allows us to graph activities or events that are not normally amendable to plotting. Icons appear any time a value exists. An icon can provide a point of reference for other data graphed on the chart.The chart below is actually a fragment of a larger chart. In that larger chart, we were trying to see if there was any correlation between the frequency of filter cleaning and nitrate levels. Indeed, there was.
In summary, it’s good practice to always enter a QTY value for each entry in the Activities Register. This gives you the option to include any type of activity in Tabular Analysis or Charts.


Sorry, comments are closed for this post.